What's happening with BTc
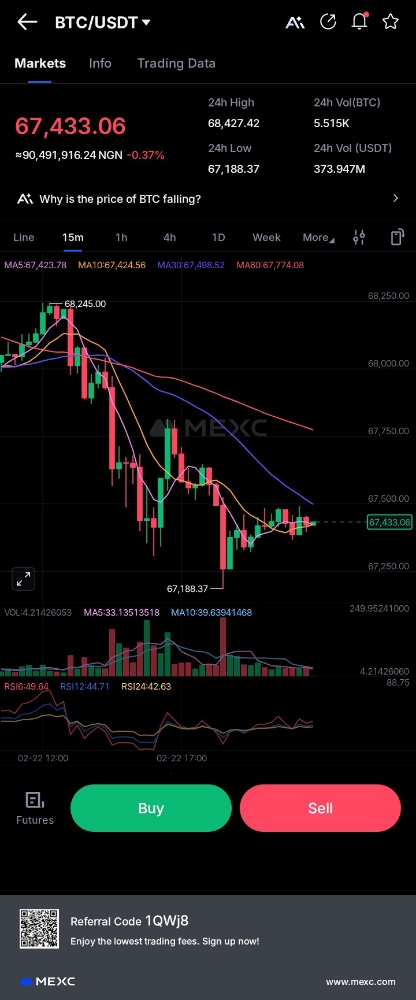
**📉 1. Market Structure – Short-Term Bearish**
Price: $67,433
24h High: $68,427
24h Low: $67,188
Change: -0.37%
From the chart:
BTC dropped sharply from around $68,245
It made a lower low at $67,188
Since then, it’s moving sideways
👉 This confirms a short-term downtrend on the 15m timeframe.
---
**📊 2. Moving Averages (MA)**
Current MA levels:
MA30 ≈ 67,498
MA60 ≈ 67,774
Price ≈ 67,433
**What this tells us:**
* Price is below MA60
* MA lines are sloping downward
* Short MAs are under longer MAs
**⚠️ This shows bearish momentum is still dominant.**
For bullish confirmation, BTC must:
Break above $67,500–$67,800
Close strongly above MA60.
From everything, you have read here, do you think BTC will go back to $90,000 and above this year or which should be expecting the opposite.