The Monthly Chart of ETH/USDT
Ethereum (ETH)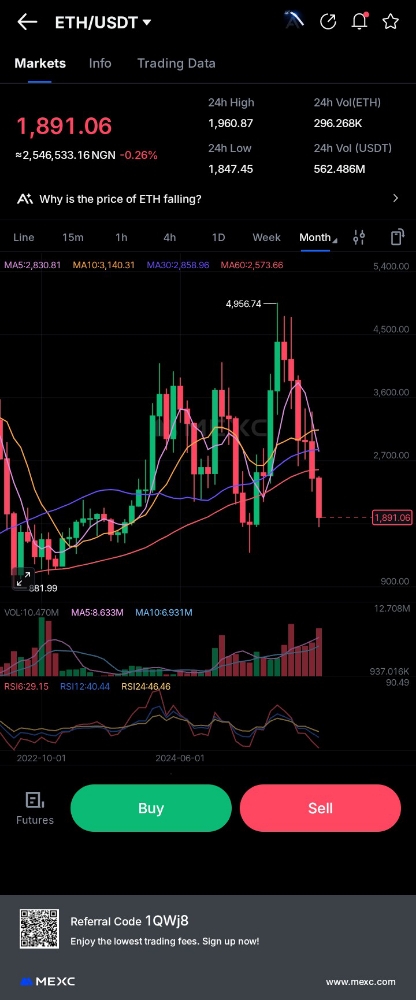
Let’s break this down properly 👇
📉 Long-Term Structure (Monthly Timeframe)
This is NOT short-term noise. Monthly charts show major trend direction.
What we see:
Previous major high around $4,956
Strong rejection from that level
Series of large red monthly candles
Current price below multiple moving averages
That signals: 👉 Macro downtrend / corrective phase
📊 Moving Averages
On the chart:
Price is below shorter MAs
Short MAs are crossing down
Momentum is weakening
That usually means: ⚠️ Sellers still control higher timeframes
For ETH to turn bullish again on monthly:
It must reclaim $2,500–$2,800 zone
Then hold above it
📈 Volume
Recent red candles show increasing sell volume.
That means:
This isn’t just small profit-taking
It’s stronger distribution
However heavy volume dumps sometimes mark mid-cycle resets, not total collapse.
🔎 RSI (Very Important Here)
RSI around 29–40 range
That’s approaching oversold on monthly timeframe.
Monthly oversold levels often mean:
We are closer to long-term support
Downside is limited compared to upside
But it does NOT mean instant reversal.
🎯 Key Levels
Major Support:
* $1,800–$1,700 zone
* If that breaks → $1,500 possible
Major Resistance:
* $2,500
* $2,800
* $3,600 strong resistance
🧠 What This Really Means
Short-term: Weak
Mid-term: Corrective
Long-term: Still structurally strong compared to smaller altcoins
ETH is not a random small coin. It’s the second-largest crypto ecosystem.